The Class of 2030 data tells the story plainly: Columbia admitted just 4.23% of applicants, Yale 4.24%, and Brown 5.35%. Four schools — Harvard, Princeton, Penn, and Cornell — declined to publish their rates at all, a transparency shift that makes strategic planning harder for applicants worldwide.
This article breaks down exactly what you're up against: school-by-school acceptance rates, multi-year trends, the Early Decision advantage, and what admissions committees actually evaluate beyond GPAs and test scores.
Key Takeaways
- Cornell has the highest Ivy League acceptance rate (~8.38% for Class of 2029); Harvard and Columbia consistently post the lowest, both under 5%
- Several schools received record-breaking applicant pools for Class of 2030, yet admitted roughly the same number of students
- ED/EA acceptance rates run 2–3x higher than Regular Decision rates at most Ivies
- Harvard's 2023–24 CDS shows 74% of enrolled students had a 4.0 GPA — meaning grades alone won't set you apart
- For Indian applicants, international applicant pools are large and country-level competition makes already-low rates even harder to crack
What Are the 8 Ivy League Schools?
The Ivy League is officially an NCAA Division I athletic conference — not an academic designation. All eight member schools happen to be among the world's most selective universities, but the "Ivy" label describes conference membership, not a formal academic ranking.
The eight schools are:
| School | Location |
|---|---|
| Brown University | Providence, Rhode Island |
| Columbia University | New York, New York |
| Cornell University | Ithaca, New York |
| Dartmouth College | Hanover, New Hampshire |
| Harvard University | Cambridge, Massachusetts |
| Princeton University | Princeton, New Jersey |
| University of Pennsylvania | Philadelphia, Pennsylvania |
| Yale University | New Haven, Connecticut |
MIT, Stanford, and the University of Chicago are not Ivy League schools — but that doesn't make them easier to get into. MIT's Class of 2029 acceptance rate was 4.6%, and Caltech's was approximately 3.78% — both comparable to or lower than several Ivies. Fixating on the "Ivy" label while ignoring these peer institutions can mean overlooking schools that are just as competitive.
The eight schools also differ considerably in campus culture, undergraduate enrollment, and academic focus. Cornell's agriculture and engineering colleges create a very different environment from Princeton's residential college system or Columbia's Core Curriculum. Where you thrive academically and socially is worth weighing alongside a school's name.
Ivy League Acceptance Rates: Class of 2029 and 2030
Class of 2029 and 2030 Data
Here is the most current data available across both class years:
| School | Class of 2029 Rate | Class of 2030 Rate | 2030 Applications |
|---|---|---|---|
| Brown | 5.65% | 5.35% | 47,937 |
| Columbia | 4.29% | 4.23% | 61,031 |
| Cornell | 8.38% | Not released | Not disclosed |
| Dartmouth | 6.00% | 5.84% | 28,863 |
| Harvard | 4.18% | Not released | Not released |
| Penn | 4.90% | Not released | ~61,000 |
| Princeton | Not published | Not released | Not released |
| Yale | 4.60% | 4.24% | 54,919 |
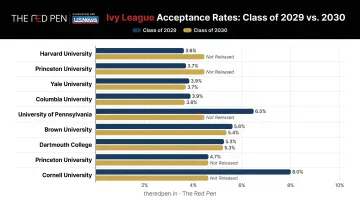
Harvard, Princeton, Penn, and Cornell declined to publish Class of 2030 acceptance rates — a growing trend toward less transparency that applicants should factor into their research. The Harvard Crimson reported that Harvard withheld acceptance rates, applicant totals, and demographic data for two consecutive cycles.
What the Application Volume Tells You
Columbia received 61,031 applications for Class of 2030 — its largest-ever pool. Yale saw 54,919 applications. Both schools admitted roughly the same number of students as prior years, which is why acceptance rates remain compressed even when the absolute number of offers holds steady.
More applicants competing for the same seats drives rates down — and there's no sign that trend is reversing.
The International Applicant Reality
No Ivy League school publishes separate acceptance rates for international applicants. What is documented: Columbia's Class of 2029 included 16% international students, and Princeton's enrolled Class of 2029 was 14.1% international.
Most Ivies hold a limited number of international spots while facing global competition from applicants across dozens of countries. For Indian students, this means competing not just against the full applicant pool but within a narrower international allocation — making the effective odds at least as tight as the headline rates suggest, and often tighter.
How Have Ivy League Acceptance Rates Changed Over Time?
Multi-Year Trend: Class of 2025–2029
| School | 2025 | 2026 | 2027 | 2028 | 2029 |
|---|---|---|---|---|---|
| Brown | 5.40% | 5.00% | 5.08% | 5.16% | 5.65% |
| Columbia | 3.70% | 3.73% | 3.93% | 3.86% | 4.29% |
| Dartmouth | 6.20% | 6.24% | 6.07% | 5.41% | 6.00% |
| Harvard | 3.40% | 3.19% | 3.41% | 3.49% | 4.18% |
| Penn | 5.70% | 6.50% | — | 5.38% | 4.90% |
| Princeton | 4.00% | 5.69% | 4.50% | 4.62% | — |
| Yale | 4.60% | 4.47% | 4.35% | 3.73% | 4.60% |
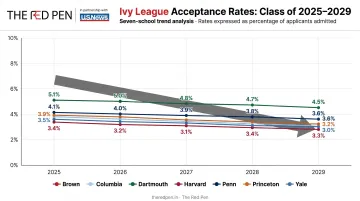
— indicates data not publicly reported for that cycle.
Sources: IvyCoach compiled statistics; official school admissions announcements
Why Rates Keep Falling
Three structural forces drive the downward trend:
- Common App expansion made applying to 10+ schools nearly frictionless
- Test-optional policies lowered the barrier to apply — Common App reports test-score-required members fell from ~55% in 2019–20 to just 5% in 2024–25, contributing to a total application volume of over 10 million in 2024–25
- Static seat counts — most Ivies have not significantly expanded undergraduate enrollment
The pandemic cycle (2020–21) accelerated the drop sharply. Rates have not meaningfully recovered since.
Cornell: A Telling Case Study
Cornell is the most "accessible" Ivy by acceptance rate, but accessible is relative. Its rate dropped from 10.70% for the Class of 2024 to approximately 8.38% for Class of 2029.
A school that admitted more than 1 in 10 applicants less than five years ago now admits fewer than 1 in 12. For Indian students targeting the Ivies, Cornell's trajectory is a useful benchmark: if even the least selective school in the group keeps tightening, building a realistic college list matters more than ever.
Early Decision vs. Regular Decision Acceptance Rates
Understanding the Round Types
Most Ivy League schools use either Early Decision (binding) or Early Action (non-binding or restrictive):
| School | Early Round Type |
|---|---|
| Brown, Columbia, Cornell, Dartmouth, Penn | Early Decision (binding) |
| Harvard | Restrictive Early Action (non-binding) |
| Princeton | Single-Choice Early Action (restrictive, non-binding) |
| Yale | Single-Choice Early Action (non-binding) |
All early deadlines fall around November 1, with decisions in December. Regular Decision deadlines are typically January 1–3, with decisions on "Ivy Day" in late March.
ED/EA vs. Overall Acceptance Rates
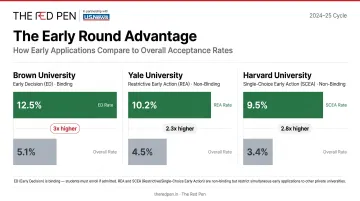
The early round advantage is real and significant:
| School | Early Rate | Overall Rate |
|---|---|---|
| Brown | 16.5% (ED, Class of 2030) | 5.35% |
| Yale | 10.9% (EA, Class of 2030) | 4.24% |
| Harvard | 8.74% (REA, Class of 2028 — most recent available) | ~4.18% |
Brown's ED rate is three times its overall rate. Yale's EA rate is more than twice its overall rate.
Why the Gap Exists
Schools use early rounds to lock in their most enthusiastic applicants, which directly helps manage yield rates (the percentage of admitted students who enroll). An ED admit is, by definition, committed. Admissions offices factor that demonstrated commitment into their selections, particularly when comparing two otherwise equal candidates.
The Financial Aid Caution for Indian Students
Early Decision is binding. If you apply ED and get in, you must withdraw all other applications — which means you cannot compare financial aid packages. If you rely on need-based aid, think carefully about this trade-off before applying ED.
That said, ED and financial support are not mutually exclusive:
- Brown confirms it meets full demonstrated need for admitted international students
- 66% of Brown's Class of 2030 ED admits applied for financial aid — meaningful aid is available
- The risk: you won't know what other schools might have offered
Harvard's and Princeton's Restrictive/Single-Choice Early Action options offer a practical middle ground. You benefit from the earlier, more favourable review without the binding commitment.
Easiest and Hardest Ivy League Schools to Get Into
The Spectrum of Selectivity
"Easiest" and "hardest" are relative terms when every school admits fewer than 1 in 10 applicants. Here's how the eight Ivies rank:
Highest acceptance rates (most accessible):
- Cornell — ~8.38% (Class of 2029)
- Dartmouth — 5.84% (Class of 2030)
- Brown — 5.35% (Class of 2030)
Lowest acceptance rates (most selective):
- Columbia — 4.23% (Class of 2030)
- Yale — 4.24% (Class of 2030)
- Harvard — ~4.18% (Class of 2029; Class of 2030 not released)
For context, Caltech's acceptance rate sits at approximately 3.78% (Class of 2029), and MIT's was 4.6% — neither is an Ivy, but both are more selective than most of the eight.
A fraction-of-a-percent difference in acceptance rate matters far less than whether the school's academic strengths, teaching style, and programme offerings match what you actually want to study.
What Ivy League Admissions Committees Actually Look For
When Perfect Grades Are the Starting Point, Not the Finish Line
Harvard's 2023–24 Common Data Set reveals that 74% of enrolled first-year students had a 4.0 GPA, with 94.4% ranked in the top tenth of their class. Nearly all submitted SAT scores fell between 1400 and 1600.
This means academic perfection is not a differentiator at Ivy League schools — it's a baseline. When thousands of applicants have near-identical transcripts, committees look elsewhere.
What Actually Separates Admitted Students
According to Yale's admissions office, applicants are evaluated through a holistic, whole-person, context-based review that includes intellectual curiosity, personal qualities, and contribution to community — not just grades.
The factors that genuinely differentiate applications:
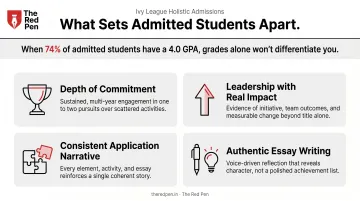
- Sustained, meaningful commitment to one or two activities — depth carries more weight than a long list of surface-level involvement
- Leadership with real impact — founding something, running a substantive project, or conducting original research
- Essays, activities, recommendations, and interview responses that tell a consistent story about who you are and what you'll contribute
- Authentic writing — essays that reveal intellectual character and genuine curiosity, not achievement catalogues
How This Applies to Indian Applicants
For students applying from India, the challenge is differentiation within a globally competitive pool. Common application experiences in the Indian context — competitive exam preparation, academic competitions, family-oriented extracurriculars — are familiar to admissions committees, which means presenting them requires more strategic framing.
That framing is precisely where structured guidance makes a difference. The Red Pen works with Indian students across CBSE, ICSE, IB, and IGCSE curricula to identify which experiences carry real weight and how to present them to committees that have seen thousands of similar profiles.
Their INK (Interactive Narrative Kit) helps students move from a list of activities to a cohesive story — connecting essays, supplements, the activities list, and recommendations into a unified application.
The team includes IACAC members and graduates of institutions including Stanford, Columbia, Oxford, and UPenn, and their partnership with U.S. News & World Report brings additional data-backed insights into how Ivy League schools evaluate applicants year to year.
Frequently Asked Questions
What is the #1 hardest school to get into?
Harvard and Columbia consistently post the lowest Ivy acceptance rates — both below 4.3% in recent cycles. MIT (~4.6%) and Caltech (~3.78%) are non-Ivy competitors that often match or beat those figures. Which is "hardest" shifts depending on your profile and each school's stated priorities.
Which Ivy League school has the highest admission rate?
Cornell University consistently has the highest acceptance rate among the eight Ivies, approximately 8–9% in recent cycles. That figure is still far more selective than the vast majority of US universities — Cornell receives tens of thousands of applications each cycle and accepts fewer than 1 in 12.
Which Ivy League admits the most students?
Cornell admits the largest total number of students per cycle — approximately 5,776 for the Class of 2030. This reflects Cornell's larger undergraduate enrollment and multiple specialised colleges (engineering, agriculture, hotel administration), not a lower bar for admission quality.
Does applying Early Decision improve your chances at Ivy League schools?
Yes — significantly. ED and EA acceptance rates are typically two to three times higher than Regular Decision rates at most Ivies. However, ED is binding, meaning you forfeit the ability to compare financial aid offers from other schools. Apply ED only to your genuine first-choice school, and only after carefully considering the financial implications.
Is it harder to get into Ivy League schools as an international student?
Ivy League schools do not publish separate acceptance rates for international applicants. International students compete for a limited share of spots against a global applicant pool, making the effective odds at least as steep as published rates — and often steeper. Strong academics alone are rarely enough; a clearly differentiated profile matters.
What GPA and test scores do Ivy League schools typically expect?
Most admitted students have GPAs above 3.9 (unweighted) and SAT scores in the 1500–1580+ range. Harvard's CDS shows an average GPA of 4.2 and an SAT middle 50% of 1500–1580; Yale's CDS reports 1480–1560 SAT and 33–35 ACT. These are ranges for admitted students — competitive benchmarks, not guarantees.